CRM Reporting Section Documentation#
The Reporting section in the CRM system provides insights into sales performance, lead tracking, and pipeline analysis.
Navigating to the Reporting Section#
-
Click on "Reporting" in the top navigation bar.
-
A dropdown appears with the following options:
- Forecast – Predicts future sales performance.
- Pipeline – Displays sales stages visually.
- Leads – Analyzes lead generation and conversion trends.
- Activities – Tracks interactions with prospects.
Key Features & Functionality#
Data Visualization#
The system provides multiple visualization formats:
Bar Charts & Graphs – Represents revenue, stages, and performance metrics.
Pipeline View – Displays the flow of deals through stages.
Table View – Lists data for easy reference.
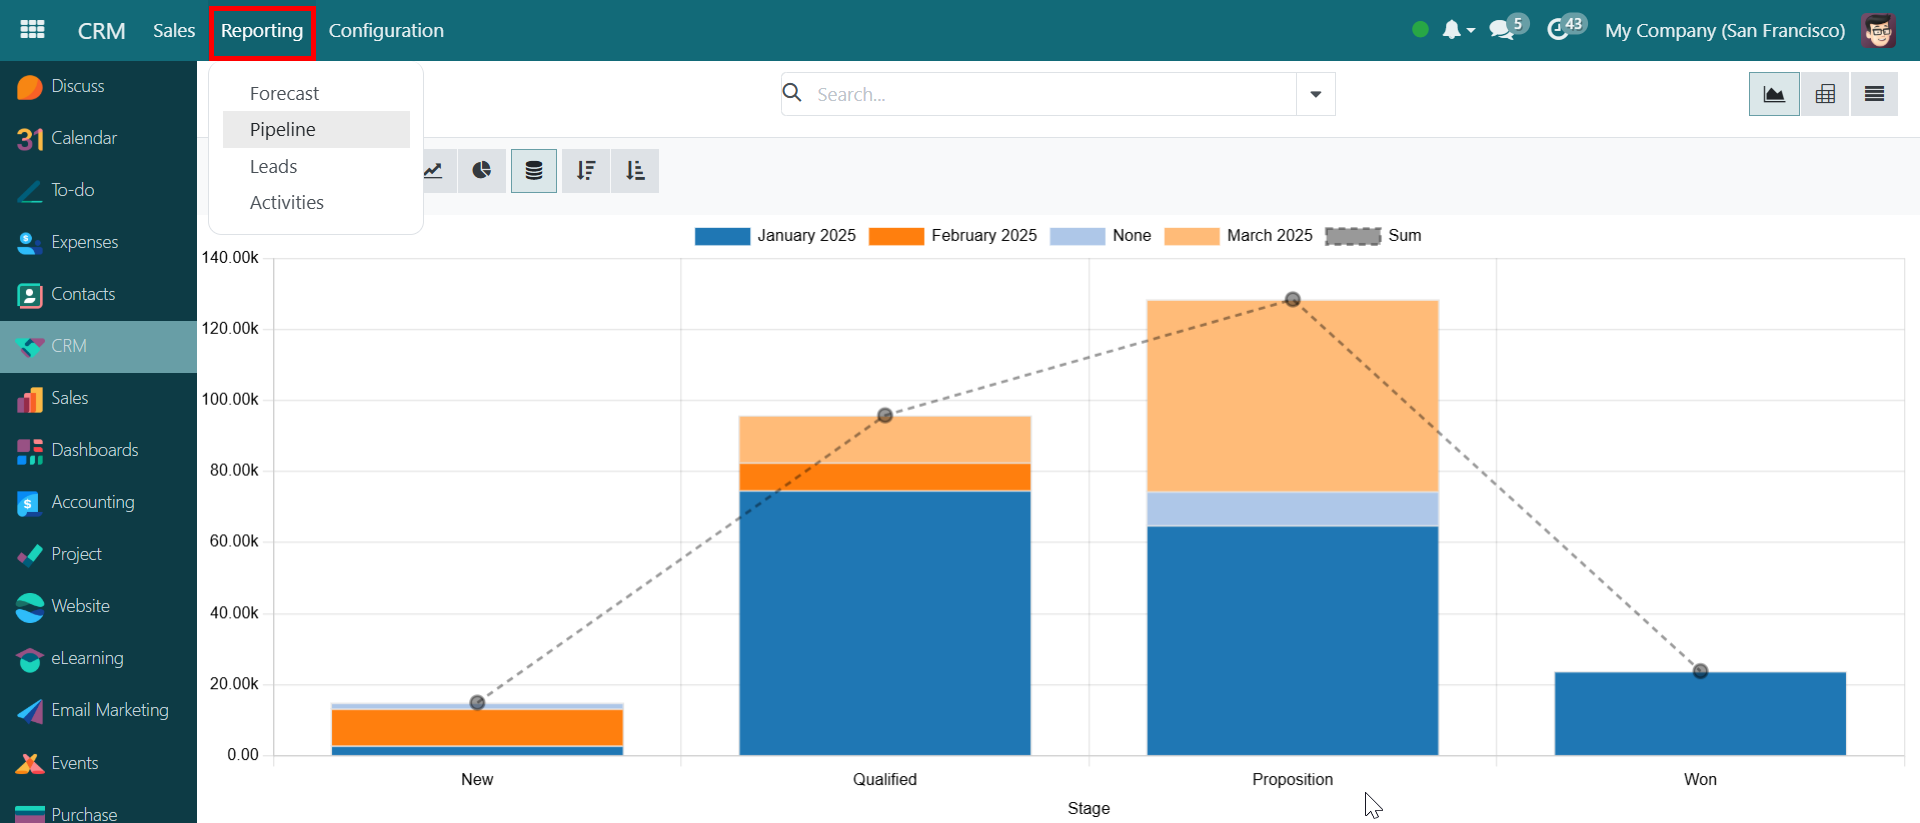
Sales Stage Breakdown#
The dashboard presents sales performance at different stages:
New Qualified Proposition Won Each stage displays expected revenue, categorized by months (January, February, March, etc.).
Interactive Elements#
Filters & Sorting – Refine reports by date, sales rep, or deal value.
Graph View Selection – Switch between different visual reports (bar chart, line graph, or tabular view).
Export & Share – Save reports in various formats for external use.
Benefits of CRM Reporting#
✅ Better Decision-Making – Helps track sales trends.
✅ Improved Forecasting – Predicts future revenue.
✅ Sales Performance Tracking – Identifies strong & weak points in the pipeline.